Can F5 be in Bridge Mode or a L2 DDOS to protect from L3-L4 DDOS attack
Hi F5 community, We just want to consult if F5 rSeries models ( Active-Standby HA setup ) with AFM license is capable to do bridge mode to cater L3-L4 DDOS protection before it goes to Internet Perimeter FW. We ask this so thatthere will be no re-architecture or change of config about the Public IP defined in the Internet Perimeter FW. If you have any document experience or KB article pertaining to this it will be a great help to us. Thank you in advance.Solved1.2KViews0likes6Comments
Logging all AFM Rules
Hello, I have multiple AFM rules, more than 300 distributed in multiple "rule-lists". Some have the "logging" option enabled and others do not. I need to enable the "logging" option for all partition rules, is there a method for this? Or some script? Thank youSolved729Views0likes3CommentsBIG-IP Advanced Firewall Manager (AFM) DNS NXDOMAIN Query Attack Type Walkthrough - part two
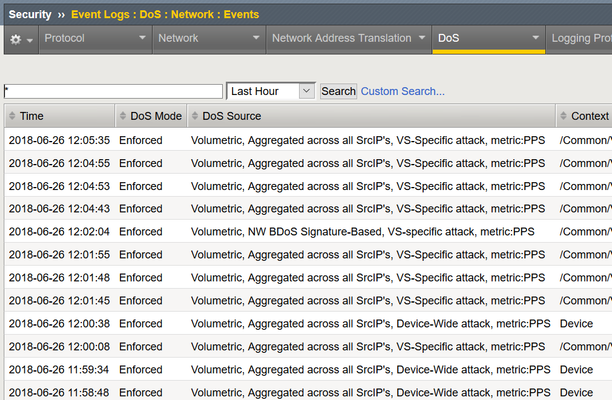
This is part two of theBIG-IPAdvanced Firewall Manager (AFM) DNS NXDOMAIN Query Attack Type Walkthrough article series. Part one is athttps://community.f5.com/t5/technical-articles/big-ip-advanced-firewall-manager-afm-dns-nxdomain-query-attack/ta-p/317656 Reviewing Part One In part one, we looked at: What and How of DNS NXDOMAIN response and flood definitions How threat actors generate random dns queries with the use of Domain Generation Algorithms and concepts such as DNS Blackhole, Fast Flux,DNS water torture attack What information can be used in observing NXDOMAIN response spike ReviewingBIG-IP DNS profile statistics collected using a periodic data collection script - provides visibility/statistics on the type of requests and responses the DNS listener processed which are useful when reviewing a recent DNS traffic spike event and understanding the characteristic of the traffic. Reviewing sample packet capture during a NXDOMAIN response spike and reducing and zooming in to the data of interest using commands such as capinfos, tshark, sort, uniq, wc Configuring Detection and Mitigation Thresholds In this article, we will continue using the information gathered from the NXDOMAIN response flood packet capture and configure BIG-IP Advanced Firewall Manager (AFM) DNS NXDOMAIN Query Attack Type Detection and Mitigation Thresholds. Configuring BIG-IP AFM DNS NXDOMAIN attack type to mitigate NXDOMAIN response spike Now that we have information from the sample packet capture and extracted DNS names we can start working on using these information to configure BIG-IP AFM NXDOMAIN attack type Detection and Mitigation thresholds. The sample packet capture we reviewed ran approx. 13 mins and recorded 60063 packets. If we divide the number of packets to number of seconds the pcap ran - 60063 p/780s, the number of packets per second is 334 packets per second. Since the packet capture contains only DNS traffic, we can expect it to have both dns requests and responses, which further reduces to 167 packets per second for either dns request or response. Since NXDOMAIN is a response and the packet capture was taken in a simulated attack to produce NXDOMAIN response, we can use this 167 packets per second as a baseline of what attack traffic looks like. We should aim for a lower number of packets per second to detect the attack and provide an allowance before we start mitigating the NXDOMAIN response flood. For the purpose of the demonstration, I have configured a lower detection and mitigation threshold to mitigate the NXDOMAIN response flood. This configuration is on a DNS enabled AFM DoS protection profile that will be applied to a Virtual Server. Dns-dos-protect is the name of the profile in this lab test. Configuring BIG-IP AFM DNS NXDOMAIN query attack type in a DNS enabled AFM DoS protection profile Detection Threshold: 20 EPS Mitigation Threshold: 30 EPS I'll be using 2 test clients to send a flood dns queries to a DNS listener for the hostnames generated thru DGA. As expected, the response for these queries will be NXDOMAIN and the AFM DNS NXDOMAIN Query Attack type will detect the attack as soon as 20 NXDOMAIN responses are observed and will start to drop excess of 30 NXDOMAIN responses. Here is a sample script to read a file , line by line, that contains DNS names to query. 10.93.56.197 is the DNS listener where the DNS enabled AFM DoS protection profile "dns-dos-protect" is applied to. root@ubuntu-server1:~# cat nxdig.sh #!/bin/bash while read -r line; do dig @10.93.56.197 "$line" done wait Here is the DNS listener DoS protection profile configuration. It also shows dos-dns-logging-profile is used as a Log profile. Here is the dos-dns-logging-profile Log profile profile configuration which only have DNS DoS protection logs enabled and logging to the local-db-publisher (logdb, a mysql db in the BIG-IP) Using the tmsh show security dos profile <DoS Protection profile name>, we can view the statistics observed by the DoS protection profile per Attack Type. In this test, only NXDOMAIN Query is enabled. Using the same periodic data capture script when we observed the ltm dns profile statistics, we can capture statistics for the DoS protection profile for review and understanding the phases of the attack being observed. while true; do date >> /var/tmp/afm_nx_stats; tmsh show security dos profile dns-dos-protect >> /var/tmp/afm_nx_stats; echo "###################" >> /var/tmp/afm_nx_stats; sleep 2; done Run the dns query flood using the script while true; do ./nxdig.sh < nx.txt 2>&1; done Here is a screenshot when the detection threshold of the NXDOMAIN Query attack type was exceeded, see the Attack Status. Here is when the Attack is being Mitigated Here is when there is no more Attack being detected A look at the periodic data capture for the DoS protection profile shows interesting statistics. Attack Detected - value of 1 means attack is detected which also means the detection threshold was exceeded, value of 0 means no attack currently detected. Stats - number of packets observed by the Attack type - this is a cumulative value since the BIG-IP booted up Stats Rate - current number of packets observed by the Attack type - provides an idea of how much of this type of packets currently observed, you can think of this as the current - Events Per Second - EPS of the attack type Stats 1m - average number of packets per second observed by the Attack type in the last 1m - provides an idea of average number packets of this type every second for the last 1m The Stats Rate and Stats 1m can provide an idea of how much packets can be seen in the current second and the average per second in the last minute. In non-attack scenario, observing these values shows what normal number of packets may look like. During an attack scenario - detection threshold exceeded - it can provide an idea how much the attack type was seeing. These information can then be used as a basis for setting the mitigation threshold. For example, it was observed that the Stats 1m value was 21 and during an attack scenario, the Stats Rate value was 245, this is about 12x of the average and the volume appears to be an attack. Depending on the risk appetite of the business, an allowance of 2x of the average number of packets for the attack type is where they want to drop exceeding packets , thus, 42 EPS can be configured for the mitigation threshold. Do note, setting low detection and mitigation thresholds can cause false positives, triggering detection and mitigation too early. Therefore it is important to understand the traffic characteristic for an attack type. In the gathered data, we can see here Attack Detected is 1, which means the detection threshold was exceeded. Stats Rate is at 245 which do exceed the 20 EPS detection threshold. Note that there were no Drops stats yet. Tue Jun 27 07:47:52 PDT 2023 | Attack Detected 1 | .. | Aggregate Attack Detected 1 | Attack Count 1 .... | Stats 1461 | Stats Rate 245 | Stats 1m 21 | Stats 1h 0 | Drops 0 4 seconds later, we do see the Drops count is 2, which tells us the Mitigation threshold - configured as 30 EPS - was exceeded. Tue Jun 27 07:47:56 PDT 2023 Attack Detected 1 ... | Aggregate Attack Detected 1 | Attack Count 1 | Stats 1h Samples 0 | Stats 1516 | Stats Rate 0 | Stats 1m 20 | Stats 1h 0 | Drops 2 3 seconds later, we do see the Drops count is 4, which tells us the mitigation is ongoing and dropping excess packets. Tue Jun 27 07:47:59 PDT 2023 | Attack Detected 1 ... | Aggregate Attack Detected 1 | Attack Count 1 | Stats 1h Samples 0 | Stats 1578 | Stats Rate 0 | Stats 1m 20 | Stats 1h 0 | Drops 4 From these sample stats, particularly the 'Stats' value, in the 7 seconds - 07:47:52 to 07:47:59 - the difference is 117 (1578 - 1461), which tells us that the packet of this type volume is low - averages at 17 packets per second for the last 7 seconds.If the difference on these 'Stats' values are much bigger, then we potentially have traffic spike. Drops stats increasing means that an attack is still being mitigated and the volume of the packets is not yet lower that the defined mitigation threshold.Drops - number of packets observed by the Attack type - this is a cumulative value since the BIG-IP booted upDrops Rate - current number of packets dropped by the Attack type Reviewing DoS stats information in the Reporting DoS DashboardWe have seen the DoS protection profile stats output, now we switch to the GUI and review the same DoS stats information.In the Reporting DoS Dashboard, there are records of the recorded Attacks. The timeframe can be adjusted to find incident of interest. In the testing done, I filtered DNS only and Attack IDs are displayed along with very useful information and statistics. In this screenshot, Attack ID 2958374472 was selected and relevant statistics are displayed. It was of DNS NXDOMAIN query Attack type/vector it shows how much packets were observed in this attack, which is 235 packets, and dropped packets at 25. Avg PPS - average packets per second for the duration of the attack, similar to the Stats Rate 1m, can also be used as a basis for the Detection and mitigation threshold of the attack type. Domain names observed are also recorded along with the same statistics on the attack. Configuring BIG-IP AFM DNS NXDOMAIN query attack type in AFM Device DoS Protection AFM Device Protection also have the DNS NXDOMAIN query attack type. This is a device wide protection and protects the self Ips and Virtual Servers of the BIG-IP. Detection and Mitigation thresholds can be configured the same way, observed the traffic type using the same type of statistics - but this time its Device DoS protection specific. Here is a sample of tmshshow security dos device-config dos-device-configoutput and piping it to grep to filter specifically lines for DNS NXDOMAIN Query. tmsh show security dos device-config dos-device-config | grep -i nxdomain -A 40 Security::DoS Config: DNS NXDOMAIN Query ------------------------------------------------------ Statistics Type Count Detection Method Static Vector - Inline Status Ready Attack Detected 1 ... Aggregate Attack Detected 1 Attack Count 20 Stats 1h Samples 0 Stats 46580 Stats Rate 187 Stats 1m 73 Stats 1h 8 ... Drops 150 ...snip.. AutoDetection 137 Mitigation Low 4294967295 Similarly, in the GUI, we can observe the states of an attack detected and mitigated by the NXDOMAIN query attack type configured in the AFM Device DoS protection. Here is the Detection and Mitigation threshold configuration Attack Detected Attack being Mitigated We can review the Reporting DoS Dashboard of the Attack events for the Device DoS and review the statistics Configuring Valid FQDNs in the DNS NXDOMAIN Query Attack type TheDNS NXDOMAIN Query Attack type has a configuration calledValid FQDNs and is described as: Allows you to create a whitelist of valid fully qualified domain names. In theAdd new FQDNfield, type a domain name and clickCheckto see if it is already on the list, clickAddto add it to the list, or clickDeleteto remove it from the whitelist. Take the name qehspqnmrn[.]fop789[.]loc as an example. Let's assume that this is a valid DNS hostname/FQDN and we do not wantDNS NXDOMAIN Query Attack type to drop packets for its response even though it would result in a NXDOMAIN response. We can add it in theValid FQDNslist from the GUI or tmsh. Here is the tmsh example, sinceqehspqnmrn[.]fop789[.]loc is already in the Valid FQDNs list, let's add another FQDN site1[.]fop789[.]loc. tmsh modify security dos device-config dos-device-config dos-device-vector { dns-nxdomain-query { valid-domains add { site1[.]fop789[.]loc } } } Here is the tmsh output when listing the DNS NXDOMAIN Query Attack Type including the Valid FQDNs. tmsh list security dos device-config dos-device-config dos-device-vector { dns-nxdomain-query } security dos device-config dos-device-config { dos-device-vector { dns-nxdomain-query { ... valid-domains { qehspqnmrn[.]fop789[.]loc site1[.]fop789[.]loc } } } } To verify that the packets for the FQDN in the Valid FQDNs list are not being dropped, we can look at theReporting DoS Dashboard. We can see ongoing attacks are reported and also lists the Domain Names in the attack. Taking a closer look at the statistics,qehspqnmrn[.]fop789[.]loc in the Domain Name list has NO packet Drops and NO Attack detected. The rest of the DNS names in the list have Drops and Attacks and are being mitigated by the AFM DNS NXDOMAIN query attack type.2.6KViews2likes0CommentsBIG-IP Advanced Firewall Manager (AFM) DNS NXDOMAIN Query Attack Type Walkthrough
Introduction In this article, we will look at configuring BIG-IP Advanced Firewall Manager's (AFM) DNS NXDOMAIN attack type in the Device Protection and DNS enabled protection profile to mitigate DNS NXDOMAIN response floods. We will review data from a packet capture and BIG-IP DNS' DNS profile statistics to set detection and mitigation thresholds. This is part one of two of this article series. Part two is athttps://community.f5.com/t5/technical-articles/big-ip-advanced-firewall-manager-afm-dns-nxdomain-query-attack/ta-p/317681 What is a NXDOMAIN dns response The DNS protocol [RFC1035] defines response code 3 as "Name Error", or "NXDOMAIN" [RFC2308], which means that the queried domain name does not exist in the DNS. Since domain names are represented as a tree of labels ([RFC1034], Section3.1), nonexistence of a node implies nonexistence of the entire subtree rooted at this node. From https://datatracker.ietf.org/doc/html/rfc8020#page-5 How is NXDOMAIN dns response generated RCODE Response code - this 4 bit field is set as part of responses. The values have the following interpretation: 3 Name Error - Meaningful only for responses from an authoritative name server, this code signifies that the domain name referenced in the query does not exist. https://datatracker.ietf.org/doc/html/rfc1035#section-4.1.1 What is a NXDOMAIN (response) flood? From the F5 Glossary in https://www.f5.com/glossary/dns-flood-nxdomain-flood The roadmap to every single computer on the Internet is held in DNS servers. The DNS NXDOMAIN flood attack attempts to make servers disappear from the Internet by making it impossible for clients to access the roadmap. In this attack, the attacker floods the DNS server with requests for invalid or nonexistent records. The DNS server spends its time searching for something that doesn't exist instead of serving legitimate requests. The result is that the cache on the DNS server gets filled with bad requests, and clients can't find the servers they are looking for. How do threat actors generate random dns queries There are many tools to generate a flood of DNS queries . The DNS records in the flood of DNS queries for the most part, should be unique if an attacker wants to poison a DNS servers cache. Otherwise, a DNS administrator can simply blackhole if the same DNS record is queried in DNS flood query. DNS Blackhole https://en.wikipedia.org/wiki/DNS_sinkhole Here is a devcentral article on DNS Blackhole implemented in an iRule https://community.f5.com/t5/codeshare/dns-blackhole/ta-p/283786 Domain Generation Algorithms To generate many random host records for one or many domains, Domain Generation Algorithms are used. https://en.wikipedia.org/wiki/Domain_generation_algorithm Many examples of DGA as collected in https://github.com/baderj/domain_generation_algorithms shows how these random records may look like. In the lab setup we will be using, we have the fop789[.]loc domain, and I borrowed from the github page random host list generated thru the "mydoom (aka Novarg, Mimail.R, Shimgapi)" DGA and appended the host part of the host list to the test lab domain . qehspqnmrn[.]fop789[.]loc mmahaesqar[.]fop789[.]loc pwprhhnqqn[.]fop789[.]loc .... Here is a sample query using the one of the hostnames. As expected, a NXDOMAIN response is received because this record does not exist in the sample lab domain fop789.loc. root@ubuntu-server1:~# dig @10.93.56.197 qehspqnmrn.fop789.loc ; <<>> DiG 9.16.1-Ubuntu <<>> @10.93.56.197 qehspqnmrn.fop789.loc ; (1 server found) ;; global options: +cmd ;; Got answer: ;; ->>HEADER<<- opcode: QUERY, status: NXDOMAIN, id: 1279 ;; flags: qr aa rd; QUERY: 1, ANSWER: 0, AUTHORITY: 1, ADDITIONAL: 1 ;; WARNING: recursion requested but not available ;; OPT PSEUDOSECTION: ; EDNS: version: 0, flags:; udp: 4096 ;; QUESTION SECTION: ;qehspqnmrn.fop789.loc. IN A ;; AUTHORITY SECTION: fop789.loc. 300 IN SOA ns1.fop789.loc. hostmaster.ns1.fop789.loc. 2023041101 10800 3600 604800 86400 ;; Query time: 4 msec ;; SERVER: 10.93.56.197#53(10.93.56.197) ;; WHEN: Sun Jun 25 11:10:41 UTC 2023 ;; MSG SIZE rcvd: 101 root@ubuntu-server1:~# The most prevalent reason why threat actors would use DGA is in malware and phishing campaigns to avoid detection and resilient to counter measures. The evasion technique used is Fast flux. Fast flux Fast flux is a domain name system (DNS) based evasion technique used by cyber criminals to hide phishing and malware delivery websites behind an ever-changing network of compromised hosts acting as reverse proxies to the backend botnet master—a bulletproof autonomous system. It can also refer to the combination of peer-to-peer networking, distributed command and control, web-based load balancing and proxy redirection used to make malware networks more resistant to discovery and counter-measures. The fundamental idea behind fast-flux is to have numerous IP addresses associated with a single fully qualified domain name, where the IP addresses are swapped in and out with extremely high frequency, through changing DNS resource records, thus the authoritative name servers of the said fast-fluxing domain name is—in most cases—hosted by the criminal actor Depending on the configuration and complexity of the infrastructure, fast-fluxing is generally classified into single, double, and domain fast-flux networks. Fast-fluxing remains an intricate problem in network security and current countermeasures remain ineffective. https://en.wikipedia.org/wiki/Fast_flux What information can be used in observing NXDOMAIN response spike There are several sources of information that can be used when NXDOMAIN response spike. BIG-IP DNS profile statistics A BIG-IP DNS listener (Virtual Server) will have a DNS profile applied to it. This profile provides access to DNS traffic statistics. In particular, "Question Type" and "Return Code" sections has statistics on DNS record types queried and return code count. Here is a sample output from a script that periodically captured DNS profile statistics - stats were taken 20 seconds apart. These were taken during a lab test where NXDOMAIN response flood is being simulated. Here is the sample script: while true; do date >> /var/tmp/dns_stat.txt; tmsh show ltm profile dns dns-prof-1 >> /var/tmp/dns_stat.txt; echo "###################" >> /var/tmp/dns_stat.txt; sleep 20; done Notice that the "Question Type" has only "A" records queried and in the "Return Code (RCODE)" , only " No Name (NXDOMAIN)" were the responses. Date: Sun Jun 25 11:15:59 PDT 2023 --------------------------------------------------- Ltm::DNS Profile: dns-prof-1 --------------------------------------------------- Virtual Server Name N/A Query Message Recursion Desired (RD) 18847 100.0 DNSSEC Checking Disabled (CD) 0 0.0 EDNS0 18847 100.0 Client Subnet 0 0.0 Client Subnet Inserted 0 0.0 Operation Code (OpCode) Query 18847 100.0 Notify 0 0.0 Update 0 0.0 Other 0 0.0 Question Type A 18847 100.0 AAAA 0 0.0 ANY 0 0.0 CNAME 0 0.0 MX 0 0.0 ... Other 0 0.0 Response Message Authoritative Answer (AA) 18843 99.9 Recursion Available (RA) 0 0.0 Authenticated Data (AD) 0 0.0 Truncated (TC) 0 0.0 Return Code (RCODE) No Error 1 0.0 No Name (NXDOMAIN) 18842 99.9 Server Failed 0 0.0 Refused 1 0.0 Bad EDNS Version 0 0.0 Name Error (NXDOMAIN) Override 0 0.0 EDNS0 client subnet 0 0.0 Date: Sun Jun 25 11:16:19 PDT 2023 Query Message Recursion Desired (RD) 18993 100.0 DNSSEC Checking Disabled (CD) 0 0.0 EDNS0 18993 100.0 Client Subnet 0 0.0 Client Subnet Inserted 0 0.0 Operation Code (OpCode) Query 18993 100.0 Notify 0 0.0 Update 0 0.0 Other 0 0.0 Question Type A 18993 100.0 AAAA 0 0.0 ANY 0 0.0 CNAME 0 0.0 ... Other 0 0.0 Response Message Authoritative Answer (AA) 18989 99.9 Recursion Available (RA) 0 0.0 Authenticated Data (AD) 0 0.0 Truncated (TC) 0 0.0 Return Code (RCODE) No Error 1 0.0 No Name (NXDOMAIN) 18988 99.9 Server Failed 0 0.0 Refused 1 0.0 Bad EDNS Version 0 0.0 Name Error (NXDOMAIN) Override 0 0.0 EDNS0 client subnet 0 0.0 Sample packet capture during a NXDOMAIN response spike Earlier, we reviewed what is Domain Generation Algorithm (DGA) and that its used to generate random DNS names which are used by threat actors in fast flux technique to evade detection and mitigations for their phishing and malware campaigns. The sample packet capture was taken while using the sample random DNS names generated thru a DGA to simulate a NXDOMAIN response flood. Using the capinfos command, we can observe various details about the packet capture. First and last packet time tells us how long this pcap was running, in this case it has been around 13 mins. Also average packet rate per second, 76 packets/sec, can be useful if we are looking to find a baseline on packets per second value. And other packet capture details which may be useful depending on your purpose. Since we are looking at DNS traffic, remember its query and response packets, so 76 packets per second, presumably may contain both type of packets, thus, estimation of 38 packets per second for dns queries. [root@bigip:TimeLimitedModules::Active:Standalone] tmp # capinfos nx-4.pcap File name: nx-4.pcap File type: Wireshark/tcpdump/... - pcap File encapsulation: Ethernet File timestamp precision: microseconds (6) Packet size limit: file hdr: 65535 bytes Number of packets: 60 k File size: 16 MB Data size: 15 MB Capture duration: 786.961838 seconds First packet time: 2023-06-25 11:05:48.352417 Last packet time: 2023-06-25 11:18:55.314255 Data byte rate: 19 kBps Data bit rate: 159 kbps Average packet size: 260.57 bytes Average packet rate: 76 packets/s SHA1: 10d3652ce3b97d68d16f324ee6eaac918b8f34d9 RIPEMD160: 7c766e4e5819fb9f5c90cee133f0e1f61e9b5801 MD5: 51cd10815de35802460ae0b26e156d66 Strict time order: False Number of interfaces in file: 1 Interface #0 info: Encapsulation = Ethernet (1 - ether) Capture length = 65535 Time precision = microseconds (6) Time ticks per second = 1000000 Number of stat entries = 0 Number of packets = 60063 Next up, use tshark to get more information from the packet capture. Specifically, we are interested in the dns related information, such as the DNS records queried and the DNS response. Extract all dns names from the packet capture - queries or response [root@bigip:TimeLimitedModules::Active:Standalone] tmp # tshark -r nx-4.pcap -n -T fields -e dns.qry.name > nx-4-pcap-records.txt Running as user "root" and group "root". This could be dangerous. Reviewing the number of dns names extracted, it matches the output from capinfos - 60063. [root@bigip:TimeLimitedModules::Active:Standalone] tmp # cat nx-4-pcap-records.txt | wc -l 60063 Sort the dns names extracted from the pcap - notice the randomness of these dns names. Could be fast flux technique or an attempt to drown a DNS server of random records that it needs to search and eventually cause service disruption - a classic DNS water torture attack. The sample DNS names taken from the pcap are still not so random and are short. There are longer and more random hostnames that can be generated by DGAs and this can really take a lot of memory and cpu resource from a DNS server. [root@bigip:TimeLimitedModules::Active:Standalone] tmp # cat nx-4-pcap-records.txt | sort | uniq -c | sort -nrk 1 3514 mmahaesqar.fop789.loc 3512 arphansaqh.fop789.loc 3509 hwepmerswa.fop789.loc 3508 qrqnswerqs.fop789.loc 3506 seenwrqrps.fop789.loc 3506 pwprhhnqqn.fop789.loc 3506 hrhspsrenn.fop789.loc 3506 arwrseqssh.fop789.loc 3505 eqqhnpswmh.fop789.loc 3504 fop789.locaehwmnms.fop789.loc 3503 qehspqnmrn.fop789.loc 3503 psrhaaeqqa.fop789.loc 3503 paepnpamea.fop789.loc 3503 ewamspqwha.fop789.loc 3501 aepaaemrmn.fop789.loc 3500 mrspmramrn.fop789.loc 3499 rnqhapapwn.fop789.loc 475 DNS Water Torture Denial-of-Service Attacks Customers reported pseudo-random subdomain or “DNS water torture attacks” hitting their networks with half a million connections per second. Outages were occurring even if a network wasn’t the direct target of the attack. For example, service providers still felt the effects as the DNS water torture traffic passed through their networks and saturated their pipes. To pull off a DNS water torture attack, an attacker leverages a botnet (or thingbot) to make thousands of DNS requests for fake subdomains against an Authoritative Name Server.1 Because the requests are for non-existent subdomains or hosts, the requests consume the memory and processing resources on the main resolver. If there are intermediary DNS resolvers inline, they too get clogged up with these fake requests. For legitimate end users, all this resource consumption means everything runs slow or even stops, resulting in a denial of service. https://www.f5.com/labs/articles/threat-intelligence/the-dns-attacks-we-re-still-seeing#:~:text=To%20pull%20off%20a%20DNS,against%20an%20Authoritative%20Name%20Server.&text=Because%20the%20requests%20are%20for,resources%20on%20the%20main%20resolver. Filtering further, we can extract the DNS response packets only [root@bigip:TimeLimitedModules::Active:Standalone] tmp # tshark -r nx-4.pcap -n -Y "dns.flags.response == 1" -T fields -e dns.qry.name > nx-4-pcap-records-response.txt Running as user "root" and group "root". This could be dangerous. DNS response packets only count shows 29994, approx half of the previous output of 60063 [root@bigip:TimeLimitedModules::Active:Standalone] tmp # cat nx-4-pcap-records-response.txt | wc -l 29994 We can then sort DNS response packets only and find the number of times each DNS name was responded to. We know that the response to these queries are NXDOMAIN because we don’t have these records in the lab DNS server records list. We can also observe which DNS names were responded the most. In the example output, each of the records were responded almost equally. [root@bigip:TimeLimitedModules::Active:Standalone] tmp # cat nx-4-pcap-records-response.txt | sort | uniq -c | sort -nrk 1 1748 qehspqnmrn.fop789.loc 1748 mmahaesqar.fop789.loc 1746 seenwrqrps.fop789.loc .... 1746 aepaaemrmn.fop789.loc 1744 paepnpamea.fop789.loc 1744 arphansaqh.fop789.loc 1742 eqqhnpswmh.fop789.loc 3161.1KViews1like0CommentsPacket Tracing in BIG-IP AFM
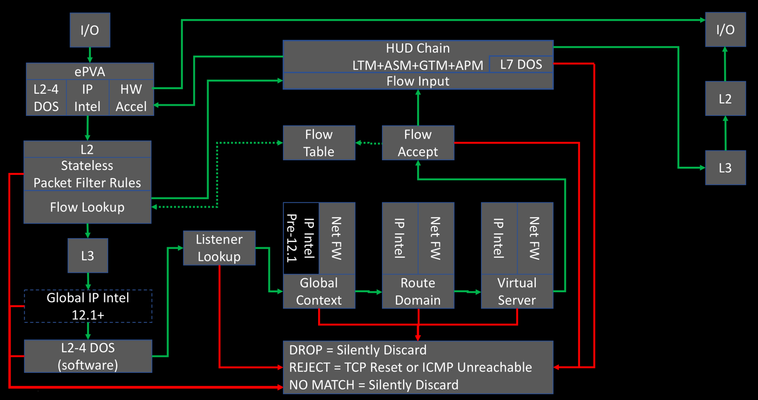
New in the v13 release of the BIG-IP Advanced Firewall Manager is the capability to insert a packet trace into the internal flow so you can analyze what component within the system is allowing or blocking packets based on your configuration of features and rule sets. If you recall from our Lightboard Lesson on the BIG-IP Life of a Packet, the packet flow diagram looks like this: The packet tracing is inserted at L3 immediately prior to the Global IP intelligence. Because it is after the L2 section, this means that a) we cannot capture in tcpdump so we can’t see them in flight and b) no physical layer details will matter as it relates to testing. That said, it’s incredibly useful for what is and is not allowing your packets through. You can insert tcp, udp, sctp, and icmp packets, with a limited set of (appropriate to each protocol) attributes for each. To get to the packet trace utility in the GUI, navigate to Network->Network Security->Packet Tester as show below. Note: In v13.1 this feature has been moved to Security -> Debug -> Packet Tester. This will launch the packet testing tool as shown here: Note with this tcp selection, in addition to setting the flags, you can configure the source and destination ip/port, source vlan, and trace options as it relates to policy and logging. An example packet trace shows the output of the trace after it completes: You’ll notice here that IP Intelligence and DoS have no beef with the packet, but there is no virtual match so the default action at the end of the path is to reject. Note that you can also use the packet trace utility in tmsh. The command is tmsh show net packet-tester security and results in an output like below. tmsh show net packet-tester security protocol tcp syn src-addr 192.168.101.2 src-port 21233 dst-addr 192.168.101.55 dst-port 8080 src-vlan external ************************* Packet Tester Data: ************************* Packet SrcIP/Port:192.168.101.2/21233 Src Vlan external Packet DstIP/Port:192.168.101.55/8080 Packet Protocol: tcp Packet Trace Option: Check Staged:Disable, Trigger Log:Disable Stage:Device-IP Intelligence Result: Default Stage:Device-DoS Result: Default Stage:Device-Access Control Result: Drop Stage:Route Domain-IP Intelligence (unset) Result: Default Stage:Route Domain-Access Control (unset) Result: Drop Stage:Listener-IP Intelligence (No Listener) Result: Default Stage:Listener-DoS (No Listener) Result: Default Stage:Listener-Access Control (No Listener) Result: Drop Stage:Device Default Result: Drop Final Result Packet SrcIP/Port:192.168.101.2/21233 Src Vlan external Packet DstIP/Port:192.168.101.55/8080 Packet Protocol: tcp Packet Trace Option: Check Staged:Disable, Trigger Log:Disable Stage:Device-Access Control Policy Name: unset Rule Name: unset Stage:Route Domain-Access Control Route Domain name: unset Policy Name: unset Rule Name: unset Stage:Listener-Access Control Listener name: unset Policy Name: unset Rule Name: unset Default Rule : No Device Default Rule Final Action : Drop Total records returned: 1 And because of tmsh, you can easily script packet generation with bash or even a tmsh script if you’re feeling the Tcl love. Current Limitations Only one packet can be inserted at a time, so even a scripted experience via tmsh will result in very low packets per second, which isn’t likely to really impact DoS for valid tests. Only valid headers are allowed, so a large part of typical red team attack vectors are not covered. No tcpdump visibility. No hardware paths. Basic visibility tools like the packet tester are great additions to the BIG-IP AFM. Whether it’s for testing new rules, validating existing ones, or simply throwing a bone over the fence to your operational security team to know where in your configuration an isolated action is being trapped, the v13 AFM packet tester has you covered!2.6KViews1like11Comments
AFM reporting no data
Hi! I have an AFM installation here that seems to be working very well as firewall and ddos protection, but the problem is that none of the reports are working. I have a logging profile created for all the VSs and the publisher is set as local-db-publisher everywhere. Logs working: Reports not working: It is also possible to observe some javascript errors being report in console: My logging profile: security log profile Log_Local { dos-network-publisher local-db-publisher ip-intelligence { log-publisher local-db-publisher } network { Log_Local { filter { log-ip-errors enabled log-tcp-errors enabled } publisher local-db-publisher } } port-misuse { log-publisher local-db-publisher } protocol-dns-dos-publisher local-db-publisher protocol-inspection { log-publisher local-db-publisher } protocol-sip-dos-publisher local-db-publisher traffic-statistics { active-flows enabled log-publisher local-db-publisher missed-flows enabled reaped-flows enabled syncookies enabled syncookies-whitelist enabled } } Am I doing something wrong? Thanks!442Views0likes3CommentsVirtual Wire configuration is not imported properly by BIG-IQ
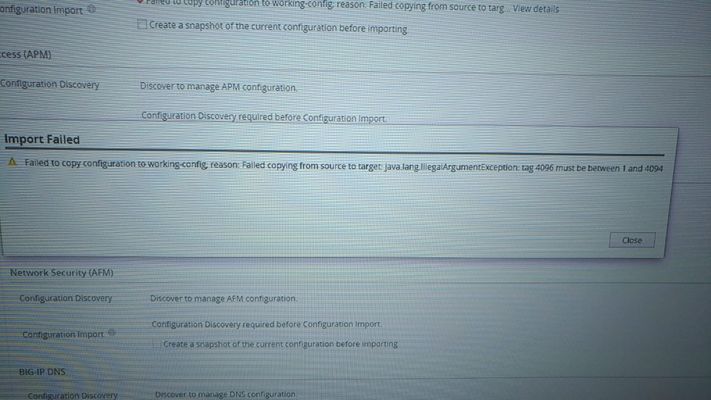
Hi, I am facing the following error when I try to import a Virtual Wire enable BIG-IP device into BIG-IQ: java.lang.IllegalArgumentException: tag 4096 must be between 1 and 4094 I know that issue related to VLAN Groups that requires the allowVlanGroup directive in restjavad.properties.json. Is there something similar to enable Virtual Wires? Thanks!311Views0likes0Comments
AFM FQDN whitelist outbound HTTP (host header) and HTTPS (SNI sub-CA cert) Data Group iRule
Hello! - We would like to be able to create a AFM FQDN whitelist irule with a datagroup entry specifically to match host header with HTTP and to match SNI with HTTPS. Decrypted inspection would utilize company sub-CA cert/key based on existing client-trusted CA. Does someone have a example data group and iRule to use for this? How can I match on an existing sub-CA cert? Would something like this work? ltm data-group internal FQDN_ALLOWED_LIST { records { .site1.com { } .site2.com { } } type string } ltm data-group internal CLIENT_CERT_INFO { records { companycertname { } } type string } #Apply to outbound AFM HTTPS VIP when CLIENTSSL_HANDSHAKE { if { [SSL::extensions exists -type 0] } then { set tls_sni_extension [SSL::extensions -type 0] } } when HTTP_REQUEST { if { ([string tolower [HTTP::host]] contains FQDN_WHITELIST) && ([class match $tls_sni_extension contains CLIENT_CERT_INFO]) } { log local0. "URL is allowed. [HTTP::host] match found in FQDN_WHITELIST" return } else { log local0. "URL is dropped. [HTTP::host] not found in FQDN_WHITELIST" drop } } #Apply to outbound AFM HTTP VIP when HTTP_REQUEST { if { ([string tolower [HTTP::host]] contains FQDN_WHITELIST) } { log local0. "URL is allowed. [HTTP::host] match found in FQDN_WHITELIST" return } else { log local0. "URL is dropped. [HTTP::host] not found in FQDN_WHITELIST" drop } } Thanks!! TJ330Views0likes0Commentsf5 sync error after VIP was deleted on A device and New VIP created with the IP being same from the deleted VIP
11.5.1 Hotfix HF7 7.0.167 Tried to Sync from a to b device reports the follwing error StatusSync Failed SummaryA validation error occurred while syncing to a remote device Details Sync error on 1b: Load failed from 1a 01020056:3: Error computing object status for virtual_server (xserver.abc.com). Recommended action: Review the error message and determine corrective action on the device213Views0likes2Comments
ACL matches per rule Context(Enforced) on F5 ASM
Hi All, When I go to F5 >> Security ›› Reporting : Network : Enforced Rules ACL matches per rule Context(Enforced). It shows Virtual Server622,780 Global111,203 AggregatedSelf IP1,336 /Common/BRIDGE-VLAN-GROUP_self_ipSelf IP603 /Common/App_x.x.x.x_VIPVirtual Server2 OverallN/A733,645 These are ACL matches per rule context.Please explain where is ACL and how this value depends on it.207Views0likes2Comments